Simulating the Rugby World Cup 2019 Japan in R
I really like running simulation models before sporting events because they can give you a much greater depth of understanding of team performance compared to the ‘raw’ odds that you might get from the media or bookmakers, or the often varied opinions of different sports pundits.
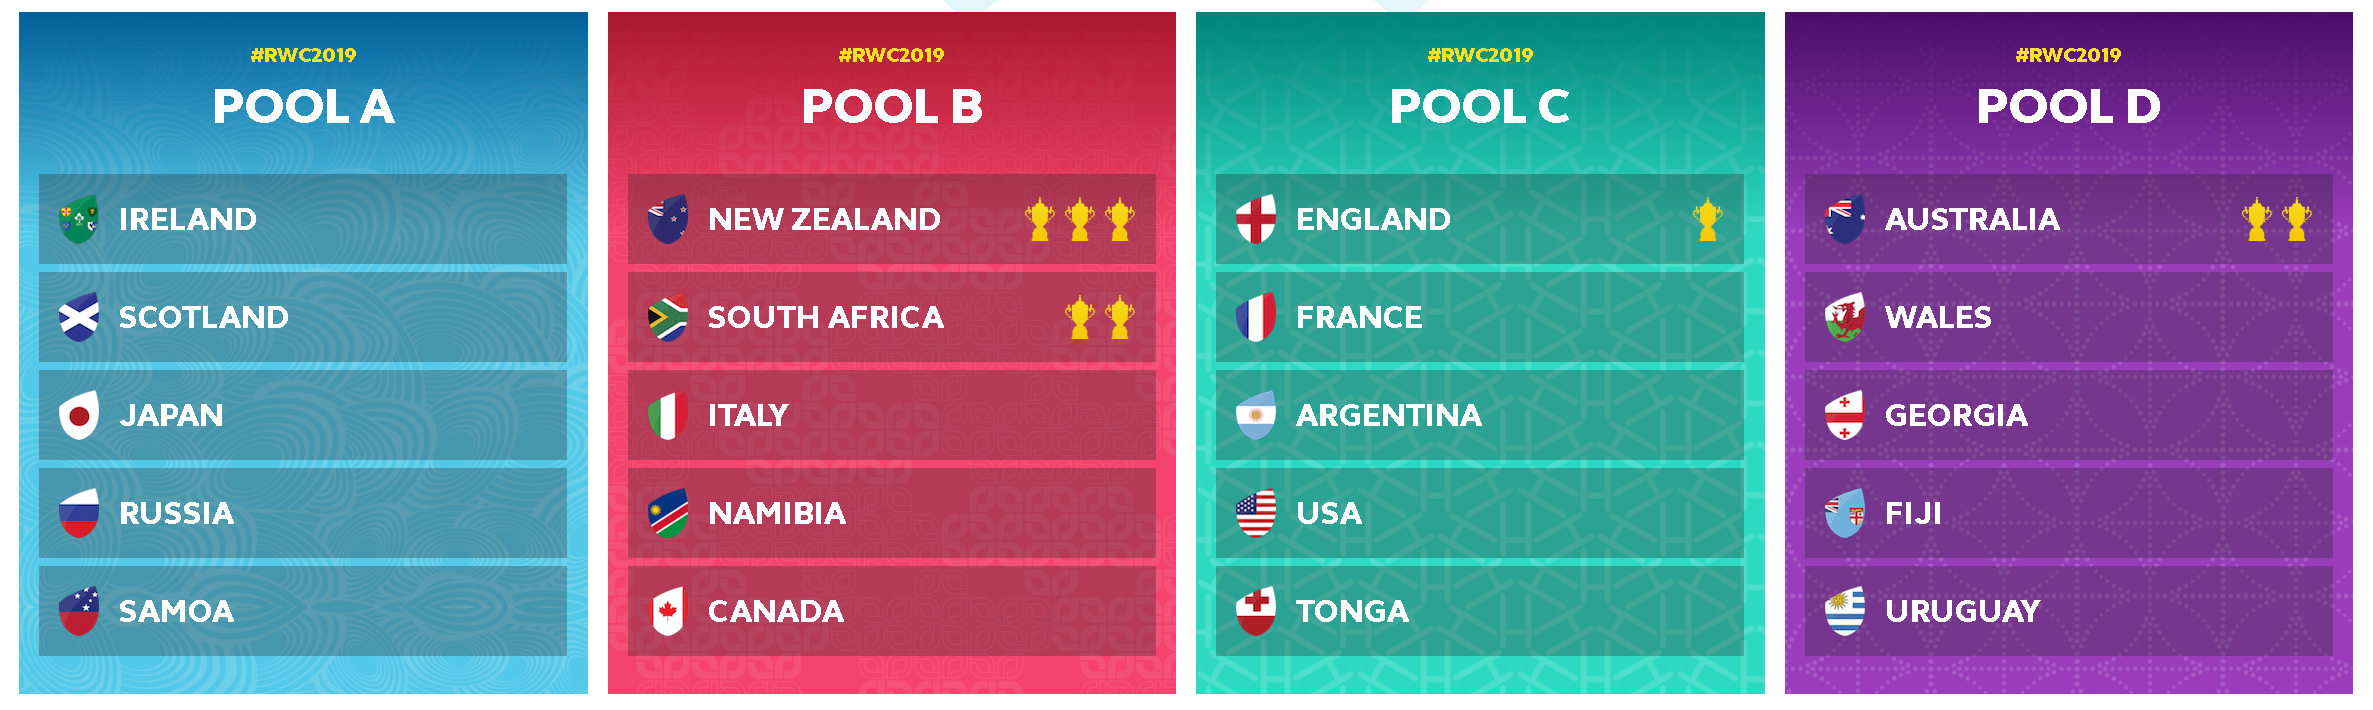
Yes, Ireland usually get knocked out in the Quarter Finals, and this is what many people are saying is most likely to happen again this year – but does the data show this? Pool C is the ‘pool of death’, right? With England, France and Argentina vying for qualification in the top two spots. Or, does Pool D hold that title, with Wales, Australia and Fiji battling it out? Oh, and we know Italy is having a tough time right now, but if we could have 10,000 world cups, would they win it even once?
That’s where a simulation can provide a lot of extra oompf for a little extra effort. If we can take the ‘raw’ odds but then add in some volatility then we can understand the distribution of outcomes.
That being said, with the Rugby World Cup 2019 officially starting in just over two weeks on 20 September, I thought I’d best run a simulation model. The model is relatively simple, but nevertheless I hope it can provide some insight into both the tournament and also more generally how to simulate a sporting competition!


Rating Data – How good is a team? Given that, how likely is team A to beat team B?
I used two different data sources:
World Rugby, the global governing body of rugby union, publishes official world rankings weekly. These have some shortcomings, although they’re widely followed by the media and have been around for many years.
Rugby Pass, a rugby broadcaster from New Zealand, publishes its Rugby Pass Index. It’s a bit of a black-box as they don’t publish their methodology, and it has only been around for a year, but they claim to use machine learning and it appears to work at player-granularity.
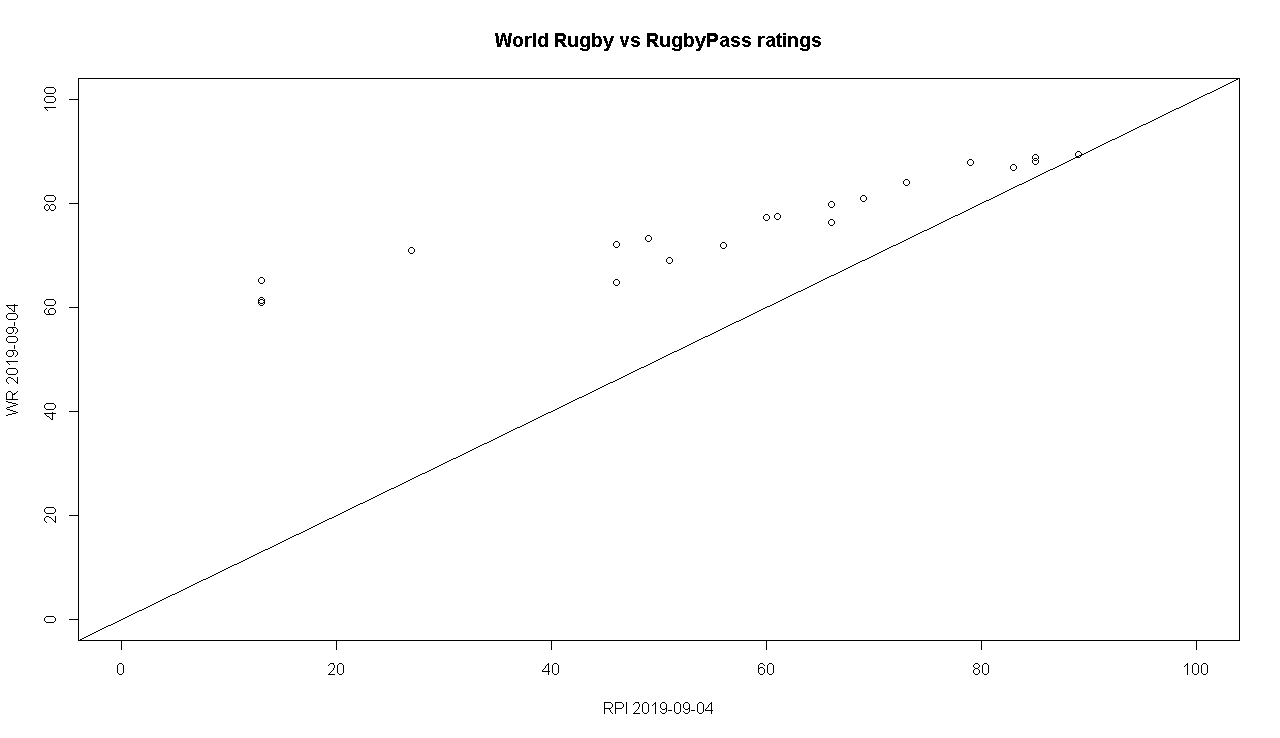
When plotted for each team, there is a fairly linear relationship between the two ratings systems, although the World Rugby rankings make a smaller gap between the lower and the higher teams.
I could write another post comparing the two ratings systems, but in a nutshell I believe Rugby Pass Index more accurately represents the current form of teams, although it doesn’t track the lower tier nations so well which the World Rugby rankings cover.
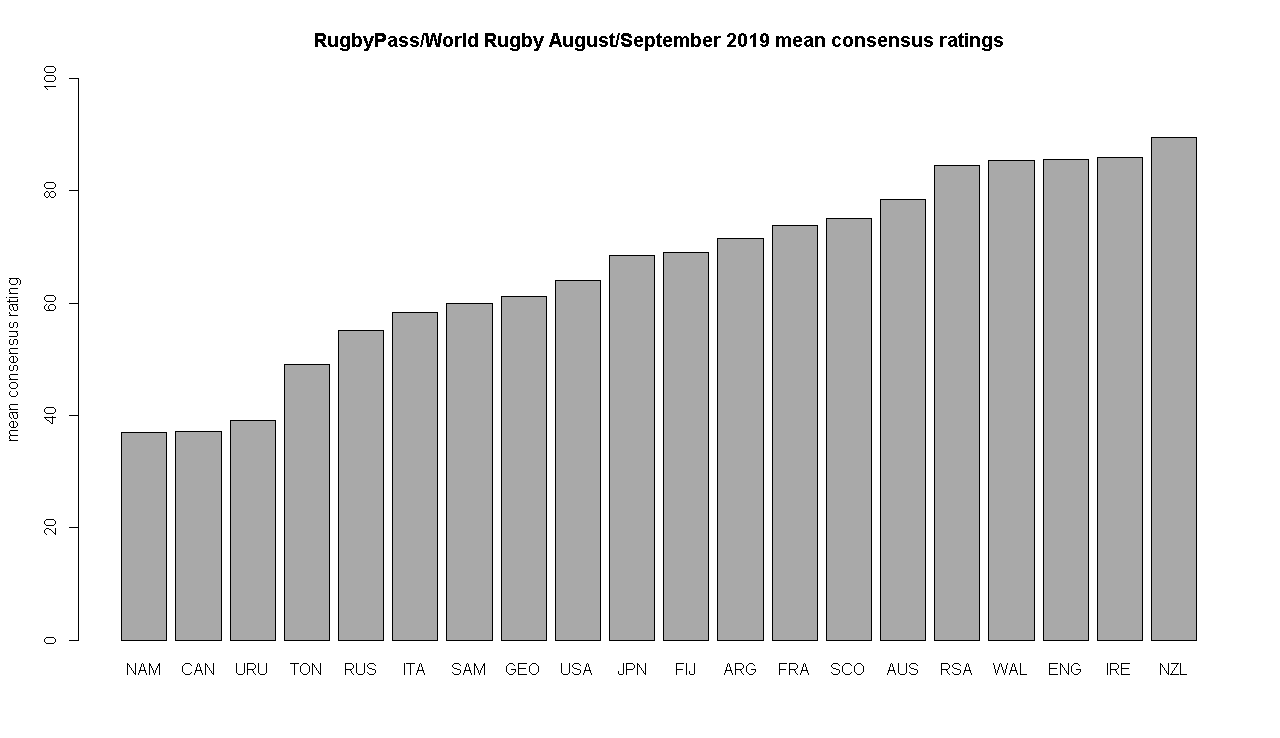
A source of recent volatility in the ratings has been the summer friendly matches, which are counted as full fixtures by both systems, although which may have been regarded by some teams as experimental/warm-up matches.
So I decided to take a consensus, using the mean of both ratings for each team, for before and after the summer friendly matches. To allow pathways for teams with performance improvement/drop between now and tournament start, a rand(-5,5) adjustment was made to each rating per simulation. Finally, Japan was given a 1.5pt home advantage adjustment as host.
The favourite team doesn’t always win – how much leeway for luck is there? We need a Distribution for Points Scored in a Rugby Match.
In a game like soccer, you get a lot of draws because goals don’t happen very often, at least compared to rugby where it’s not unusual to see 60pts or more scored per team. What does a distribution of points look like?
If we can define this then combined with the ‘raw’ probability of winning we can take random samples of it during multiple simulations to understand the distribution and volatility of outcomes.
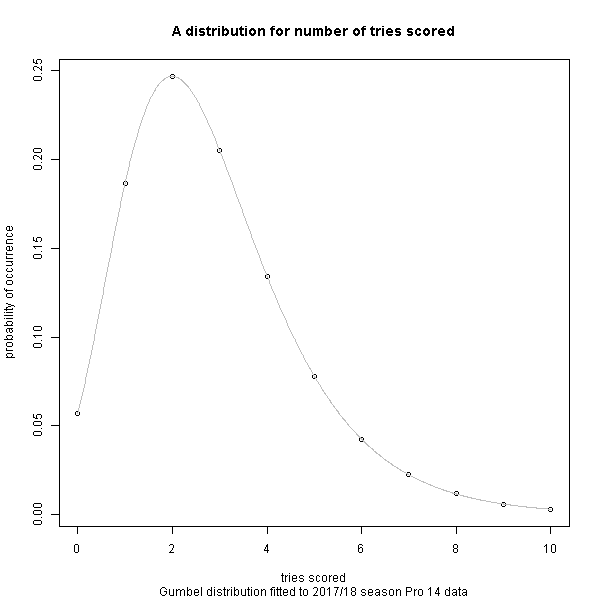
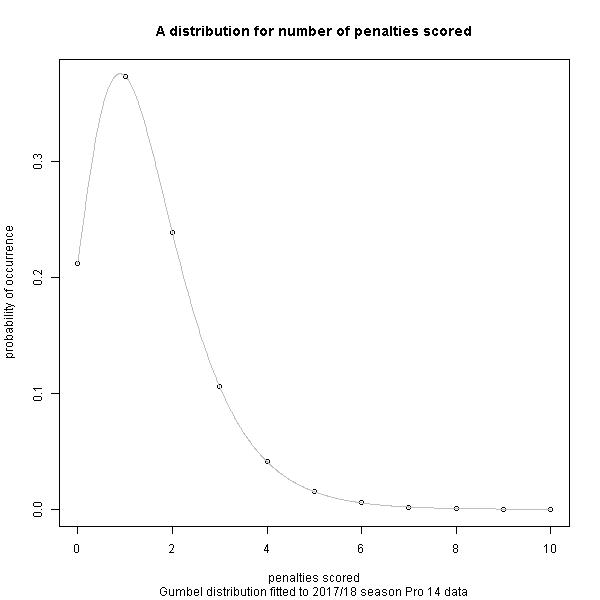
For the general probability distribution of occurrence of tries scored, conversions given a try has been scored, and penalties scored, I have recycled a distribution I calculated previously based on a season of the European club Pro 14 competition. Perhaps in another post I will look at how this compares to the distribution in international/RWC matches but for an initial model this is sufficient.
Now that we have the probability of winning, and can randomly sample from the distribution of points scored, we can build our Monte Carlo model!
For each match simulation, a random sample of the probability distribution on tries, conversions, and tries scored was taken and essentially multiplied by the probability of winning for each team. For each tournament simulation, the results were recorded and the tournament was simulated again, until we got 10,000 simulated tournament results.
Finally, let’s look at some results – the pool stages.
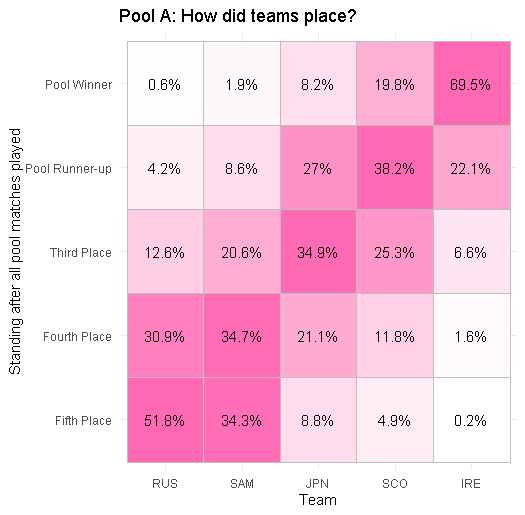
Pool A: Ireland and Scotland most likely to qualify, although it’s plausible that Japan in particular could humble one of them and qualify instead.
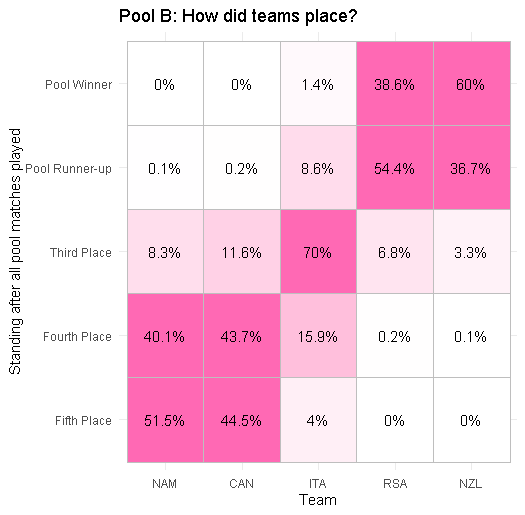
Pool B: this is far more clear-cut! New Zealand and South Africa are very likely to qualify, unless Italy causes an upset. Although Italy are unlikely to be upset by Namibia and Canada who will battle it out for fourth place.
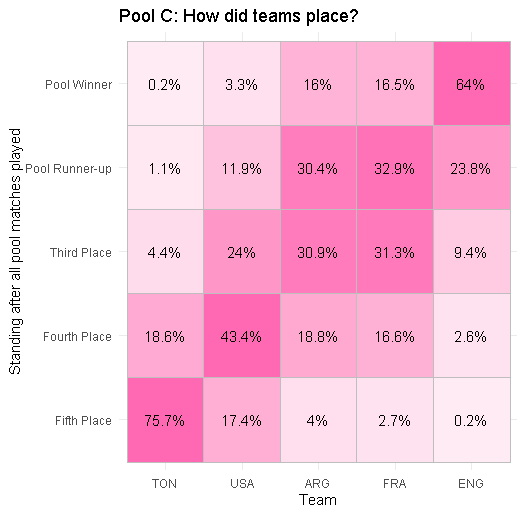
Pool C: England are fairly likely to qualify, but Argentina and France would have to battle it out for runner-up. USA has a fair chance then of causing an upset. Although it would have to be an upset against the winner of Argentina v France which would seem unlikely. I hope to build this feature in by dynamically changing the ratings as the tournament simulation progresses, for a future version.
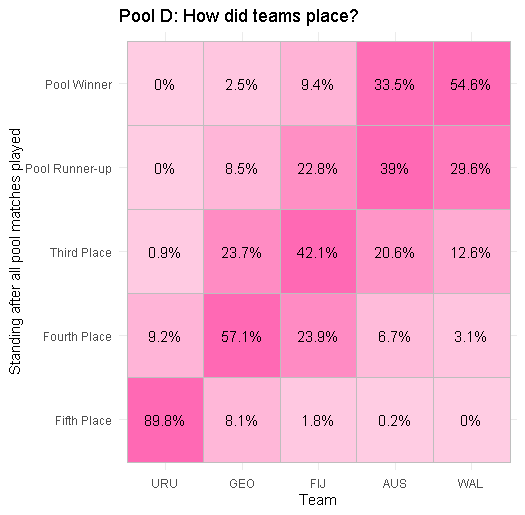
Pool D: a similar picture to Pool A with Australia and Wales being favourites to qualify, unless Fiji manage to force an upset. Equally, Georgia are looking like a strong fourth team, who could themselves upset Fiji by taking third place. All whilst Uruguay look the most certain of any team to finish bottom of their group.
I’m calling out Pool D now as a good pool to watch for the neutral fan!
Won’t you tell me, who’s going to win the World Cup?
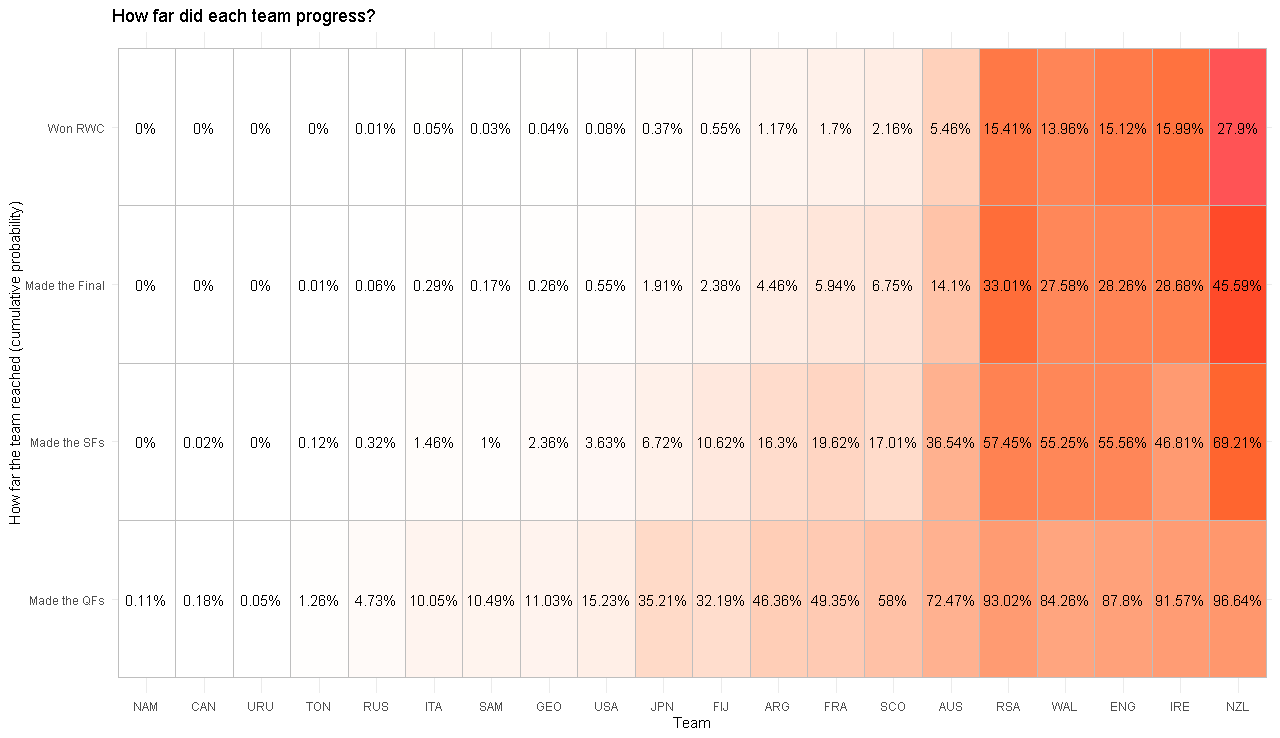
It’s perhaps no surprise that the New Zealand All Blacks, current World Cup holders with the strongest legacy in world rugby are favourites to win (28% chance), with close to double the odds of their nearest rivals (16% chance). However these four rivals: Ireland, England, Wales, South Africa all share roughly the same odds (as a bloc accounting for 60% of the chance). The remaining chance is taken up by Australia (5% chance), Argentina, Scotland and France (1-2% chance each) with remaining teams having less than 1% chance. So, unlike at the FIFA soccer World Cup last year, which saw relative outsider Croatia make the final, it’s very unlikely a team from outside these top nine teams will win the tournament.
This story cascades down when we look back to the semi-final and quarter finals. With effectively six very strong teams and three fairly strong teams that makes in most cases only nine teams vying for eight places to get into the knock-out stages which means there is not much volatility in this regard.
Fiji, Japan, USA, Georgia, Samoa, Italy all have a plausible chance of causing an upset in the pool stages and making it to the quarter-finals.
Barring a near-miracle, Russia, Tonga, Uruguay, Canada and Namibia are unlikely to reach the finals, although I look forward to some good pool stage matches from these teams who successfully battled qualification to make it to Japan.
Are Ireland going to go out in the quarter-finals?
The subject of much debate given Ireland’s recent volatile performance, with the notable statistic that Ireland has been knocked-out in the quarter finals in six out of the past eight world cups. As an Ireland fan, it pains me to say that Ireland (45% absolute chance) are the team most likely to exit at the quarter finals! It doesn’t make it any better, but they are followed by Scotland (41% chance) and Australia (36% chance).
Most likely to exit at the semi-finals are Wales (28% chance), Engalnd (27% chance), South Africa (24% chance).
Wrap-up
Well, I hope you enjoyed this as much as I did. The code, as ever, is available via Git here. I’ll hopefully follow-up soon with a post about a Sankey plot to visualise the stats more effectively.